In May 2026, the median home sale in San Anselmo closed at $2,055,000. One month later, in June, MLS-sourced data put that same figure at $1,631,000. Same town, same handful of streets, a $424,000 gap in the reported number, all inside thirty days.
If you are stacking San Anselmo against Larkspur or San Rafael on a spreadsheet, a swing like that looks like a market coming apart. It isn't. It's a market small enough that a single month's mix of closings can move the headline number by six figures, and once you know how to separate that noise from the real trend underneath it, San Anselmo's numbers actually tell you something useful.
The Steady Number Underneath the Swings
Start with what actually held steady across three separate measurements. Redfin's tracking, over the three months ending August 2026, put San Anselmo's median sale price at $1.5 million, down 8.8 percent from the same window a year earlier. The June 2026 MLS-based report showed that month's median down 9.4 percent from June 2025. Zillow's home value index, as of July 2026, showed the town's average value down 8.5 percent year over year.
Three different data sources, three different methodologies, and all three land within a percentage point of each other on the year-over-year direction: San Anselmo values softened by roughly 8 to 9 percent over the past twelve months. That consistency across independent measurements is the real signal. It's a genuine, moderate cooling, not a collapse, and it shows up whether you're looking at a rolling three-month median, a single calendar month, or a smoothed value index.
What isn't a signal is the month-to-month whiplash. A 20 percent drop between May and June doesn't mean the market lost a fifth of its value in thirty days. It means something about which homes happened to close changed, and in a town this size, that happens constantly.
Why the Month-to-Month Number Jumps Around So Much
San Anselmo sells somewhere between 20 and 35 homes in a typical month. That's not a large enough sample to average out the effect of a couple of unusual transactions. Even two data providers looking at the identical month can land in different places. For June 2026, the MLS-sourced report put the sold median at $1,631,000. Movoto, tracking the same month independently, reported $1,575,000. Neither number is wrong. They're just two snapshots of a pool small enough that a handful of transactions can shift the middle.
The deeper reason this happens is geographic. San Anselmo isn't one housing market wearing one zip code. It's several distinct pockets of very different housing stock, and which pocket happens to trade in a given month determines where the median lands.
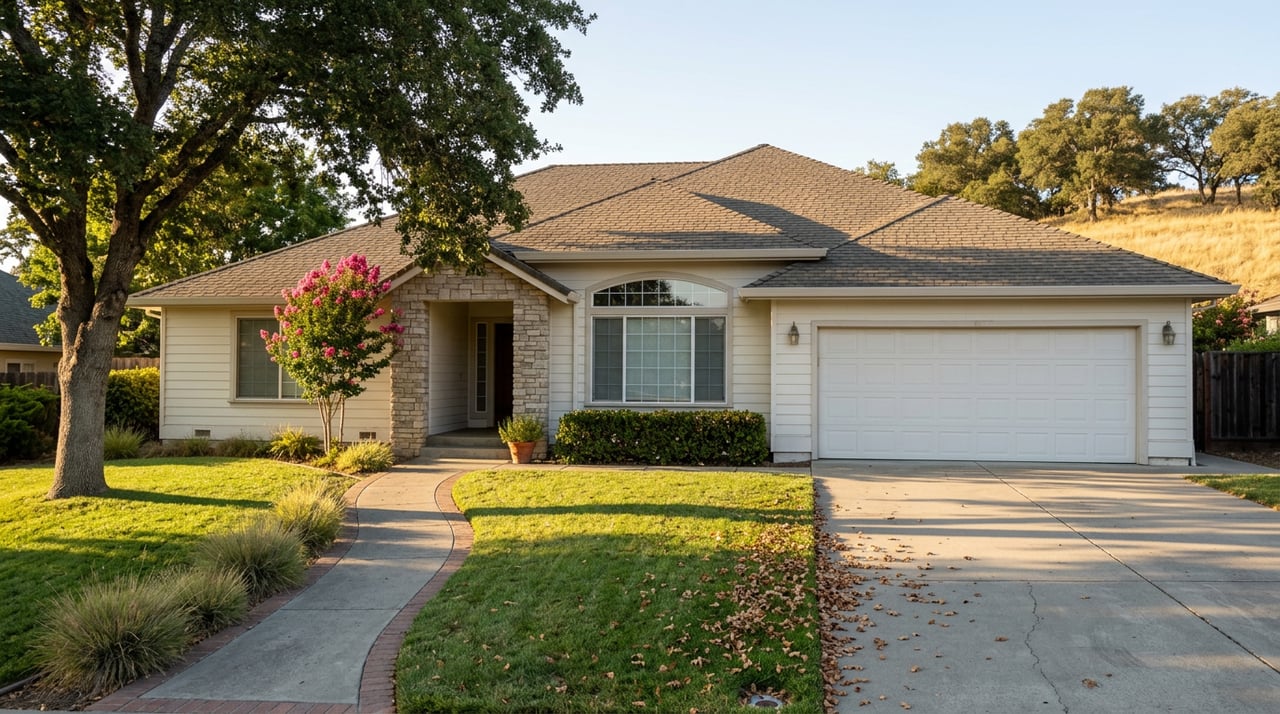
- Sleepy Hollow, on the town's northwest edge, holds roughly 750 homes built starting in the 1950s, mostly one-level ranch style on third-to-half-acre lots, some over an acre, reached by Butterfield Road and organized around its own homes association with a clubhouse, pool, and tennis courts.
- The Yolanda District and Winship Park carry San Anselmo's pre-1940s bungalow stock, where the real value question is original detail versus a stripped remodel, not square footage.
- Barber Tract sits close to the shops and restaurants on San Anselmo Avenue, its vintage homes prized for walkability as much as anything else.
- The Seminary neighborhood, clustered near the San Francisco Theological Seminary, holds some of the town's higher-priced hillside properties.
- Red Hill mixes older homes with newer construction near the Red Hill Shopping Center and Memorial Park.
If three Sleepy Hollow estates close in the same month, the median jumps well past $2 million. If the month's closings skew toward Yolanda District bungalows, it can land comfortably under $1.5 million. Neither outcome means the town's overall value changed. It means the sample that month happened to be drawn from a different part of the map.
What Rose While the Median Fell
Here's the detail a falling median can hide entirely. Over the same three months ending August 2026, San Anselmo's median price per square foot rose 11.7 percent year over year, to $1,050. Price per square foot strips out the effect of which size and style of home happened to sell, and it moved in the opposite direction from the median.
Demand indicators moved the same way. By August 2026, homes were averaging 19 days on market, down from 25 days a year earlier, on 34 sales that month compared to 27 in August 2025. The June 2026 report showed homes that did sell closing at 111.9 percent of list price, even as 42 active listings sat with a median ask of $1,722,500 and an average of 55 days on market.
Put together, that's not a picture of buyers losing interest. It's a picture of a market where well-priced homes still move fast and above asking, while a separate pool of listings sits longer at higher price points. The falling median, in that context, looks more like a shift toward smaller or more modestly priced homes closing in a given stretch than evidence that San Anselmo buyers are pulling back.
One Cost Line That Doesn't Move With Any of This
If you're weighing San Anselmo against another Marin town, one detail is worth knowing regardless of which month's median you're staring at: San Anselmo has no Mello-Roos Community Facilities Districts anywhere in town. What you will see on a tax bill is the standard Ross Valley flood control zone fee and the Marin Wildfire Prevention Authority parcel tax, both routine line items rather than the kind of special assessment that can catch buyers off guard elsewhere in the county. It's a small thing, but it's the kind of fixed cost that stays constant while the headline sale price bounces around from month to month.
Reading the Number Correctly
When you pull up San Anselmo listings and the median looks like it swung wildly from the last time you checked, the useful question isn't "did the market crash" or "did it recover." It's "what closed this time." A rolling three-month window smooths out more of the noise than a single month ever will, and price per square foot tells you more about underlying value than a headline median that's one estate sale away from doubling. If you're comparing this town against others on your list, ask for the specific neighborhood the homes sold in, not just the town-wide number, because in a market this size, the neighborhood is often the real story the median is hiding.
If you're trying to make sense of what a San Anselmo listing actually says about value, in Sleepy Hollow, the Yolanda District, or anywhere in between, Jennifer Bowes can walk through the comps that matter for your specific search and help you read past the headline number to what's actually happening on the ground.